Recently, we shared with you the methodologies behind the venue accessibility pilots that we already did as part of our Amsterdam for All project. Today, it is time to dive into the topic of pedestrian accessibility. First, we look at Jorrit Ypenga's approach to detecting canal railings on panorama images. Next, we dive into Johanna Fiebag's methodology for analyzing temporal obstacles such as parked micromobility vehicles on the narrow streets of Amsterdam. Finally, we give you a sneak peek into our ongoing project and our future plans on the way to accessible route planning.
While the City of Amsterdam and many other organizations keep a good track of assets in the public space and analyze mobility from many different angles, there is only limited work and resources related to the topic of pedestrian accessibility. In turn, people with reduced mobility, elderly citizens, or parents with strollers often encounter issues while navigating the streets of Amsterdam. Lack of curb ramps, steep bridges, or parked bikes blocking the sidewalk - these are only some of the challenges that hinder free movement for all Amsterdammers. Thus, last year we set out on a mission to start mapping accessibility information automatically. In this blog post, we dive into technical details related to some of our sidewalk accessibility projects.
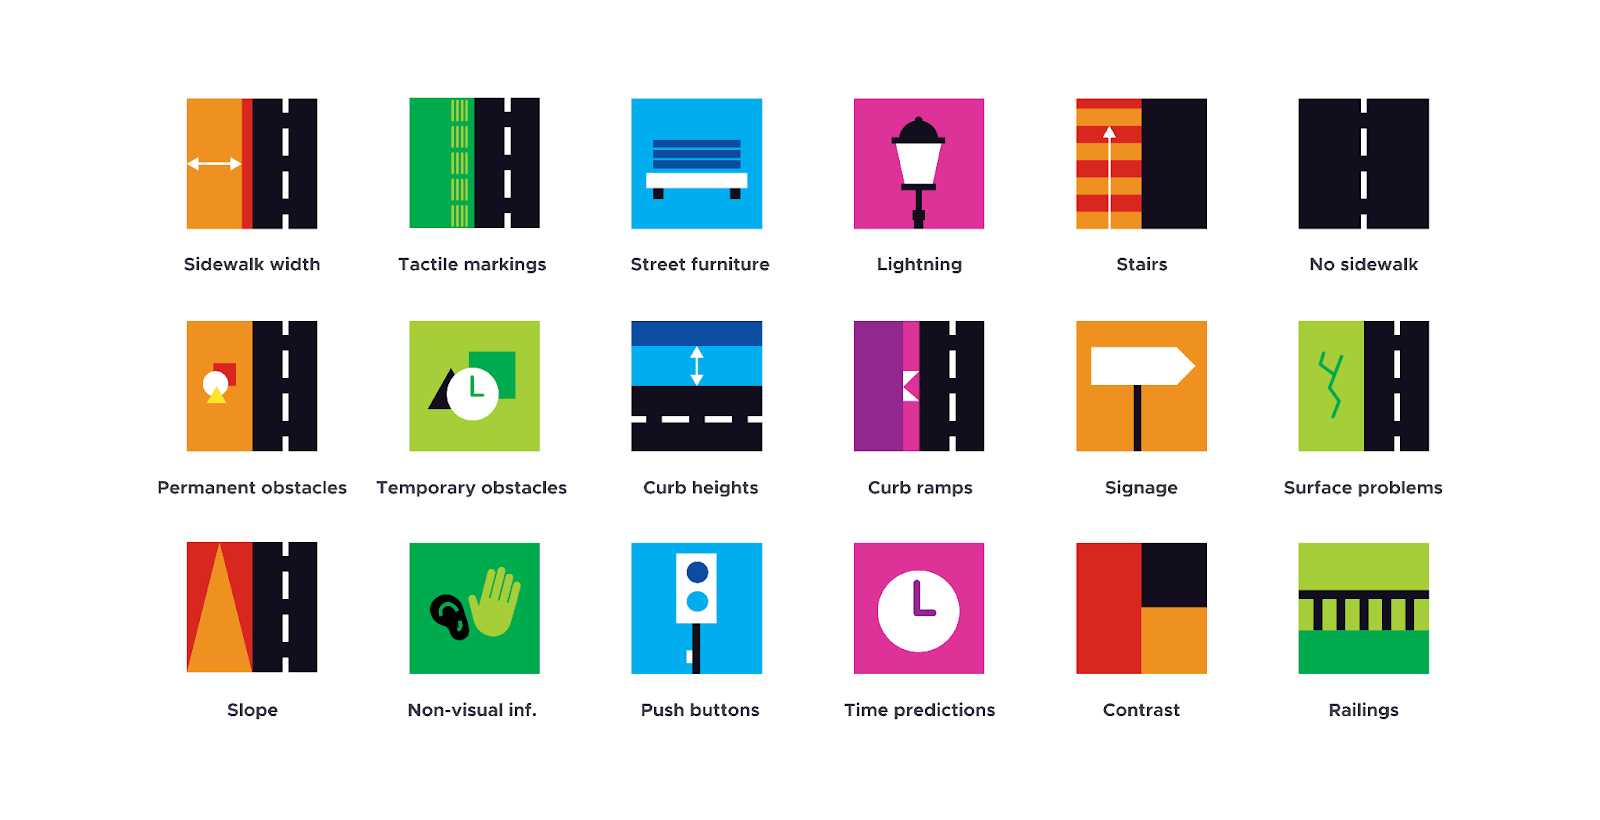
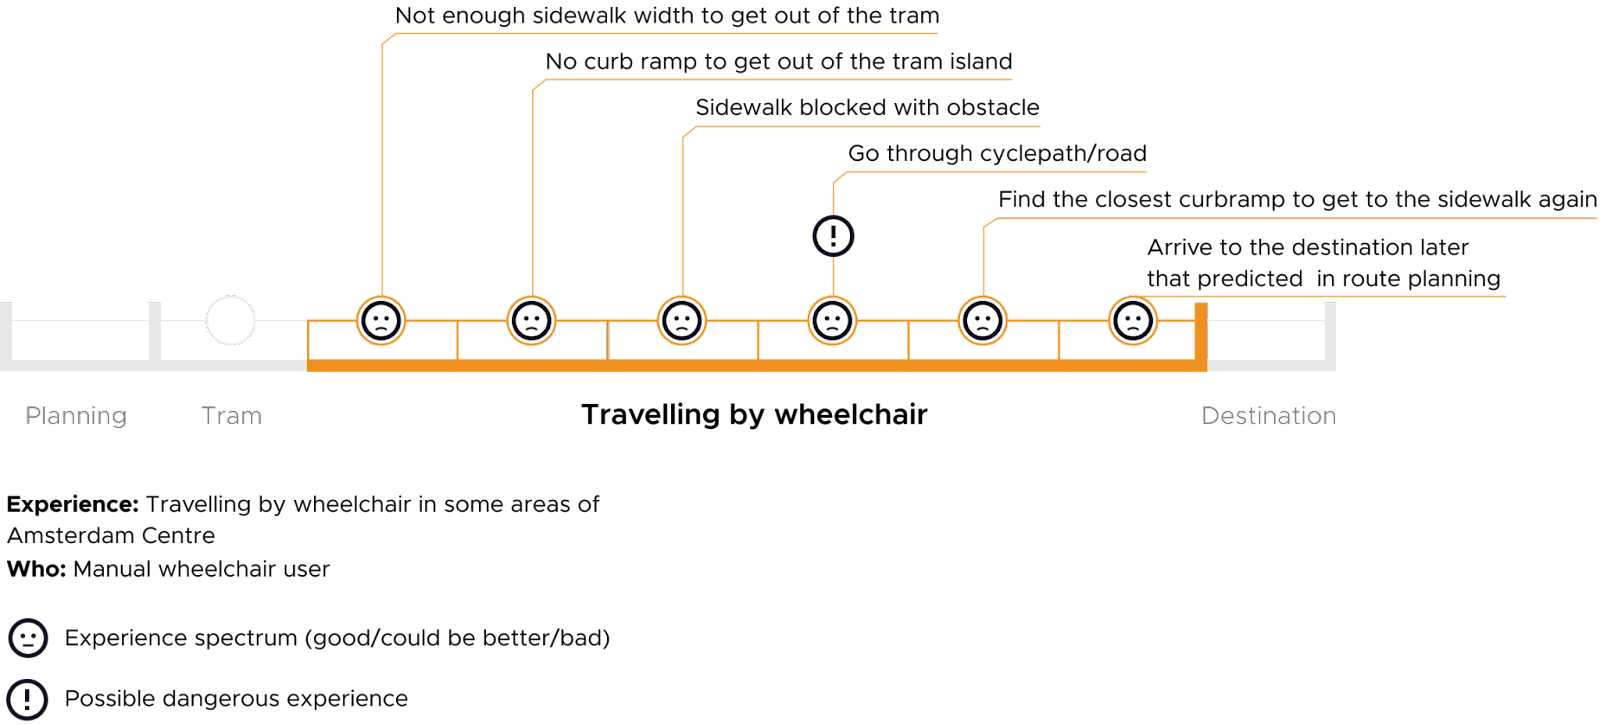
Information requirements that people with different disabilities have, to decide on a route that is suitable for them
Detecting Protective Canal Railings on Panorama Images
Amsterdam is said to have 75 kilometres of canals. The majority are located in the historic centre of the city. While they are beautiful for some, these canals can pose a hazard to people with reduced vision or mobility. Railings or other guiding elements should be placed at the limits of the quay walls, so we can prevent accidental falls. Since the current regulations state that railings are not required in quay walls (Regelgeving hekwerken op bruggen en kades) and frequently no other guiding elements are being placed, it is important to identify where the potentially hazardous areas are.
Mapping the availability of canal railings can be beneficial for integrating appropriate notifications or detour options in (voice-guided) navigation. In addition, it can be a starting point for city officials to improve the existing policy and place railings at dangerous places. Thus, we explored the possibility of automatically mapping the canal railings together with Jorrit Ypenga.
Step 1: collect and annotate data
As with many other applications, we decided to use our panorama images. Next to the ones taken from the streets of Amsterdam, there are also images taken from a boat on the canals. These images are ideal for detecting canal railings, as they provide a direct (almost) unobstructed view of the quay walls on both sides.
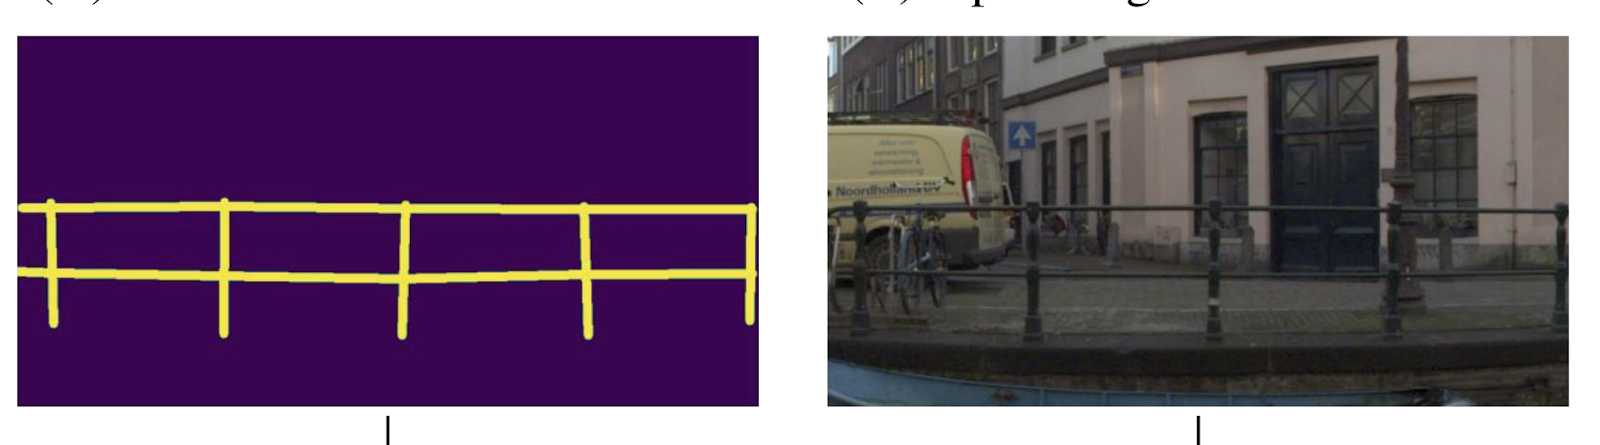
The first step of the proposed pipeline is to use the information about the orientation of the camera to create two rectified images looking at the quay walls on both sides of the boat. Next, together with Spectrum Intelligence, we annotated a dataset consisting of 2000 images to be used for training and evaluation. Fence detection is usually treated as a semantic segmentation task which requires pixel-level annotations. To optimise the annotation process, we opted for a multi-line annotation setup, covering as much as possible the solid parts of the fences.
Example of the multi-line annotation of a fence

Step 2: do fence segmentation
First, the line-annotation setup allows Jorrit to experiment with different line widths of the annotations to balance between the quality and quantity of labelled pixels. Next, he runs multiple experiments to find an optimal setup and the best-performing encoder-decoder architecture for the task. Experiments are performed with several existing methods such as U-Net, as well as established backbone models such as ResNet and EfficientNet.
Step 3: post-process and locate missing fences
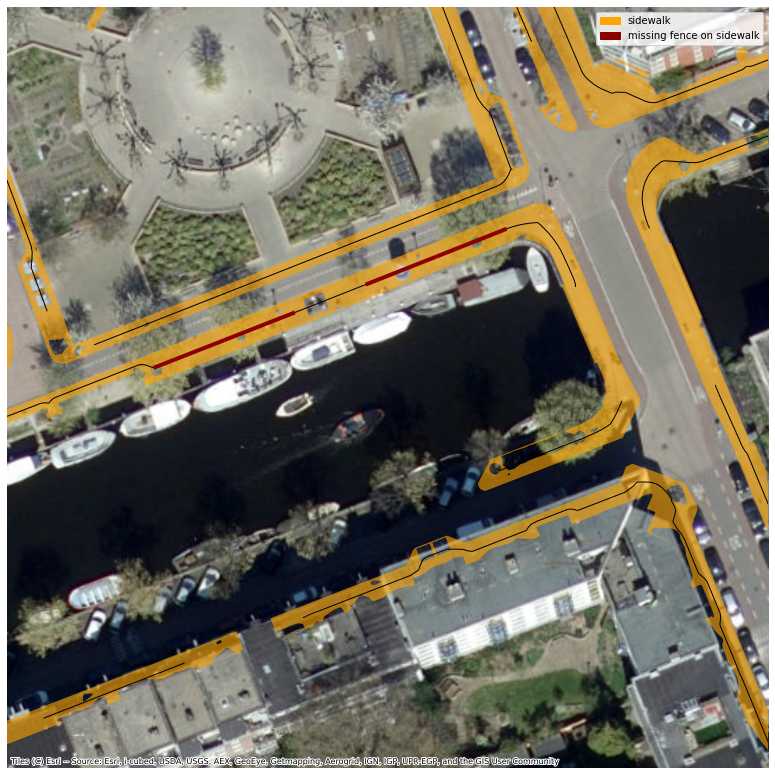
The final step of the pipeline is to interpret and visualise the results. Once we have detected (or not) fences on the images, we need to find the precise location on the map to visualise this information. We choose to make use of the coordinates of the images together with the known locations of water (available in BGT as “waterloop” and “watervlakte”) to estimate the location where a perpendicular line from the route of the boat intersects with the quay wall. Next, we find the closest known sidewalk path within close proximity (set at 3 metres) - this is assumed to be the part of the sidewalk impacted by the presence or absence of a protective fence.
Limitations
One of the biggest drawbacks of the proposed approach is the high number of false positives. Manual inspection of the results shows that the model occasionally erroneously detects the metal rails of bike parking facilities and railings of houseboats as canal railings. Thus, further improvement of the model and careful integration into navigation systems is required to avoid the negative impact of these false detections. We do, however, hope that the insights into true negatives (that is, missing fences) can be used to protect citizens and improve the safety of the canals.
Analysing and Predicting the Parking Occupancy of Micromobility Vehicles on Sidewalks
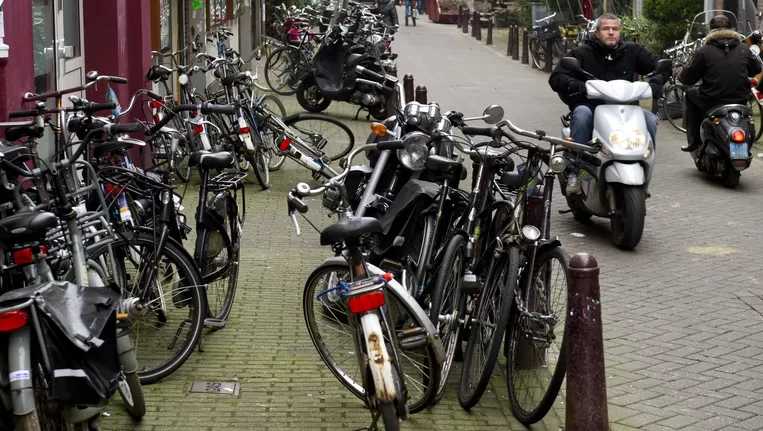
Accessible sidewalks are relatively free of obstacles. Previously, we assessed permanent obstacles in determining the obstacle-free width of sidewalks. Here, we focus on non-permanent obstacles blocking the sidewalk, specifically bicycles and other micromobility vehicles such as scooters. While biking is a fun, healthy and green way to explore the city, when parked inconveniently, a bike can limit the opportunity for others to roam around freely.
For her thesis, Johanna Fiebag analysed and predicted the parking occupancy of micromobility vehicles on sidewalks. Our final goal is to assess the risk of a certain sidewalk to be blocked by vehicles parked outside racks. These results can be used in accessible route planning, where a high (or unknown) vehicle blocking risk can be a reason to avoid a certain (stretch of) sidewalk. Secondly, the results can be used by the municipality to identify which areas are most problematic.

We use historical counts of micromobility vehicles. Due to the used counting protocol, the data is temporally sparse (max four counts per location). We also include a wide variety of neighbourhood characteristics, like the number of nearby restaurants, land use (residential/work/services), shopping areas and tram stations (the full list of datasets and corresponding sources can be found in Johanna’s github repository). The pipeline consists of clustering similar sidewalks, predicting the number of vehicles and finally assessing accessibility.
Step 1: create clusters of similar sidewalks
We create clusters of sidewalks, to deal with some of the randomness of specific counts in our sparse data. In addition, we would like to be able to make predictions for locations with little or no historical data. Six clusters are created based on neighbourhood characteristics and parking behaviour. As some of our features are numerical and others are categorical, we use the partition algorithm k-prototypes (which allows for mixed data types).
Step 2: predict number of vehicles parked outside of racks
The clusters themselves, as well as the historic counts per cluster, are used as features in the next step. They are included in the prediction model, next to historic counts per sidewalk and neighbourhood characteristics per sidewalk. Johanna used a random forest to predict the number of vehicles parked outside the official parking facilities on the sidewalk per 100 m2.
The random forest outperforms the baseline, as well as her XGBoost model and multilayer perceptron. The historic counts are the most important features, followed by the land-use features (residential, work and services).
Step 3: assess accessibility in terms of vehicle parking risk
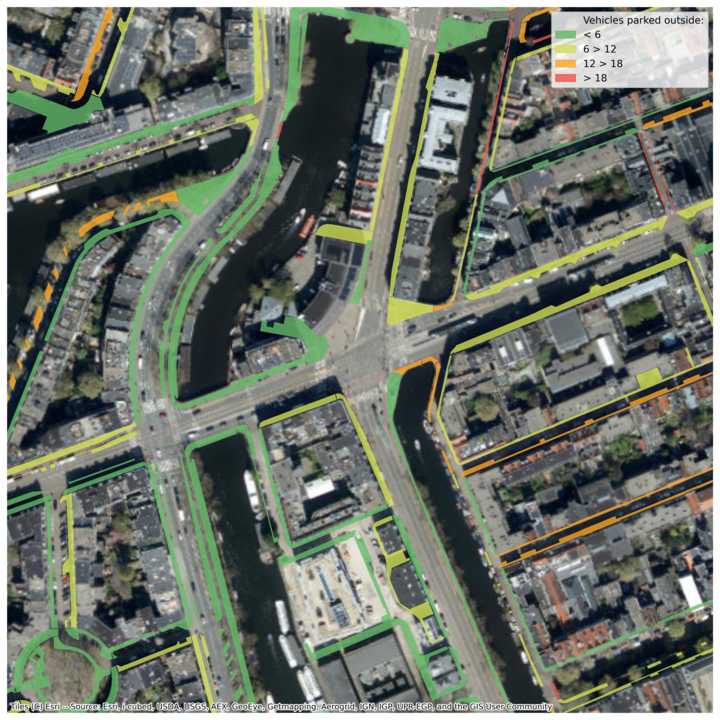
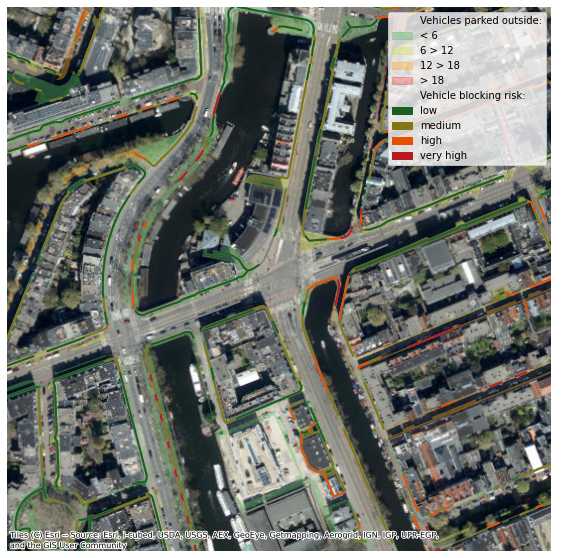
Finally, the predicted vehicle counts are binned into low, medium, high and very high. These predictions for each of the sidewalks (areas) are projected to pedestrian routes (lines) on the sidewalks. Combined with the width of the corresponding part of the route, this results in a low, medium, high or very high risk of a route on the sidewalk being blocked by vehicles. The areas and lines can be seen in the example image below, coloured by the predicted vehicle count and the vehicle blocking risk, respectively.
Limitations
The main limitations of the vehicle blocking risk results are caused by the sparsity of the historic data. Due to the (labour-intensive) data logging process, predictions can only be made on a yearly basis. To be able to predict the count of vehicles for more specific periods of time, we recommend researching different methods for collecting training data, for example by making use of existing sensors in the public space. Combining this approach with the clustering results would allow us to make near real-time predictions for wider areas of the city.
Towards Personalized Route Planning
Both of the above advancements offer useful insights into some concrete aspects of the accessibility of sidewalks. In the next months, we will be working on combining these with the data generated by our accessible sidewalk width research. Furthermore, together with Andrea Lombardo, we will attempt to extract information about accessibility infrastructure (such as e.g. curb ramps) from panorama images. For this, Andrea will also make use of the crowd-sourced Project Sidewalk data. Finally, using all of these datasets combined into a single network, Alisa Todorova and Aditi Mishra will help us make a start on a personalised route planning approach.
* Cover Image Source: hva.nl