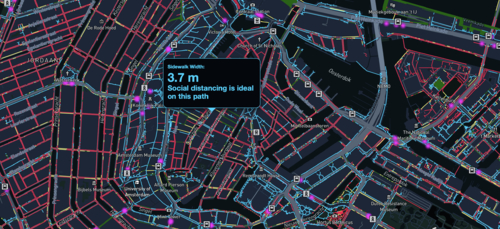
With growing numbers returning to the city streets, it is clear that public space (or lack of it) can hamper our ability to keep a safe distance. The Social Distancing Dashboard is stepping up to this challenge. It offers an overview of different factors affecting our ability to respect social distancing rules. By developing high-resolution maps, we are highlighting detailed information relevant to social distancing in an urban setting - such as the wide of the footpath and the location of bus stops and other transport hubs.
The resulting dynamic and color-coded maps are available for use by policymakers, charged with making decisions on public health and city planners, tasked with making COVID-19 related interventions in the urban space.
The dashboard is also relevant to city residents - especially hose in risk groups - who want to navigate the city streets as safely as possible.
Data Sources
Basisregistratie Grootschalige Topografie (BGT)
The digital map of the Netherlands. It contains the digital layout of the physical environment, including building, roads, waterways, terrains and railway lines. The map is accurate to 20 centimeters.
Centraal Bureau voor de Statistiek (CBS)
The Dutch statistical office provides the District and Neighborhood Map (2019), an up-to-date version of the digital geometry of the boundaries of Dutch neighborhoods, districts and municipalities.
Open Street Map (OSM)
Open Street Map is a collaborative project. It contains the digital layout of the physical environment, and the geo-location and description of several Points of Interest (POI) types, e.g. public transport hubs.
Source and link to site: Social Glass - Social Distancing & The City
Link to Dashboard
