Every article has keywords (eg: 'Nature & Environment'). Keywords give meaning to articles on open research and make connections. The graph function visualizes these relationships. An article is displayed as a green icon in the graph function. One or more persons are associated with an article, which are shown in blue. The articles and persons are linked to each other by means of keywords (yellow icons).
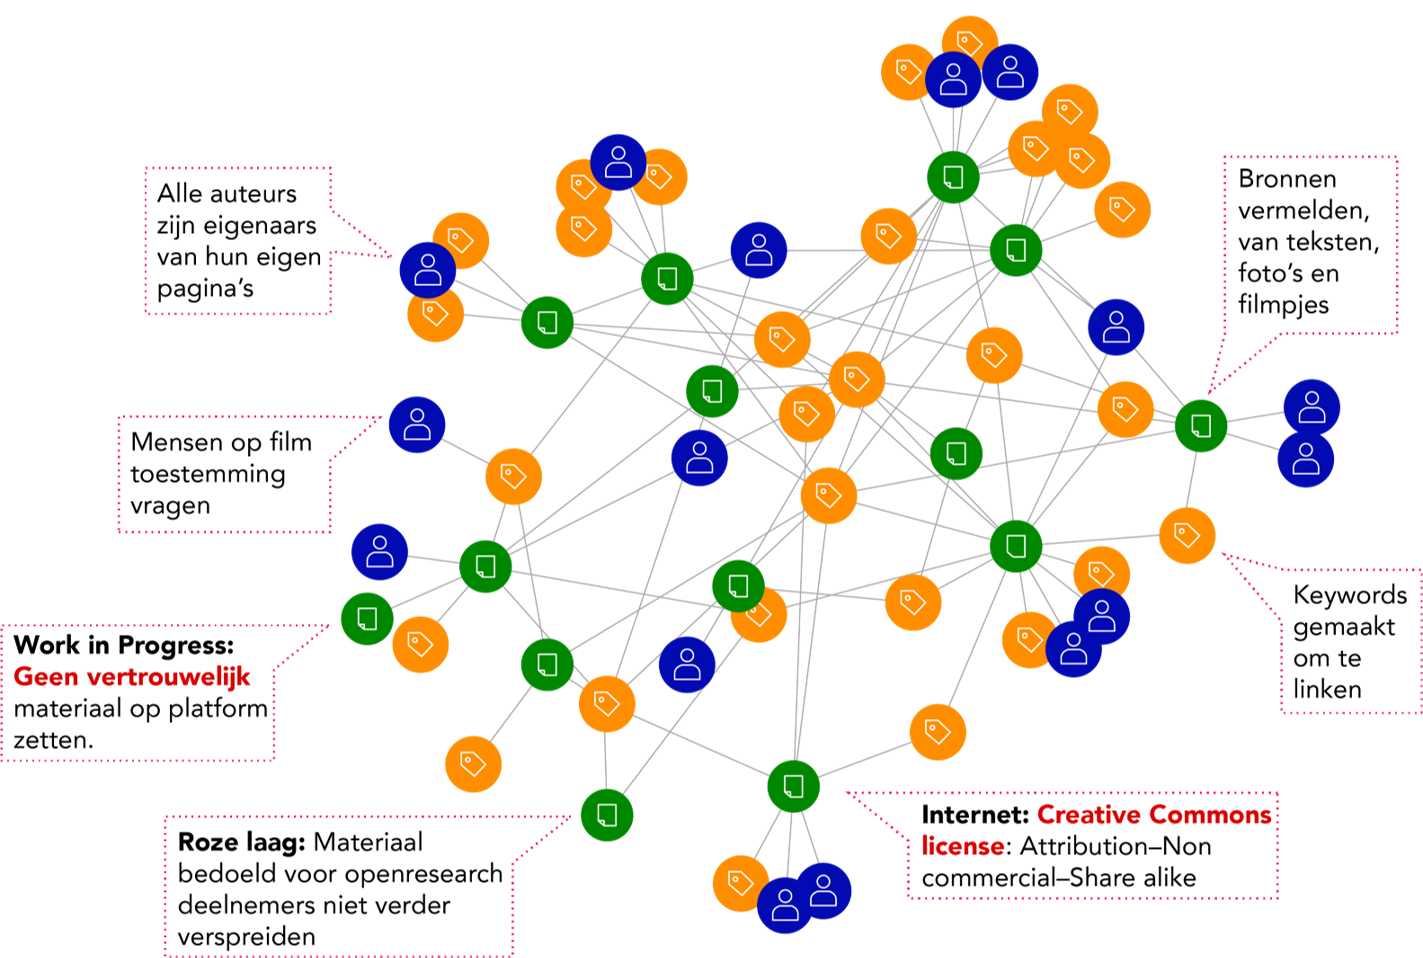
The graph function shows who is working on which themes in the Amsterdam Metropolitan Area. This allows you to reflect on your work and your subject. You can also see how themes are associated with each other. Under 'Traffic & Transport' you will find research and information about walking, trains and cars. And how do themes such as diversity and area development interact? In open research, information is linked in terms of content. By adding keywords to your articles you will be included in the graph.