The City of Amsterdam has the ambition to offer its citizens independent and equal participation as much as possible. However, people with disabilities encounter a high variety of barriers when moving around or participating in the city. We believe recent advancements in artificial intelligence can be crucial in finding and solving these bottlenecks. To guarantee a meaningful, useful and usable application of AI, we have partnered with World Enabled, who will guide us through the process.
"Recent studies suggest that 25% of all people encounter barriers in cities based on age or disability. With the right partnerships and tools we can accelerate the development and deployment of new urban tech and G2G solutions at scale. We look forward to embarking on this journey and leveraging the combined technical capabilities of Intelligent Amsterdam and World Enabled. - Dr. Victor Pineda, President of World Enabled
The advancements in the field of Artificial Intelligence potentially open up a whole range of new possibilities in tackling this topic, allowing for new ways to measure accessibility with a generic and scalable approach. Over the past months, we have been talking to experts about city design, diversity and inclusion to find out which problems need to be tackled.
In the next few years, we will be using the powers of Artificial Intelligence to help cities become more accessible. In this blog post, we will describe how we chose the different research directions, possible ways to tackle them, and why we think they can be beneficial.
Choosing the topics
To kick start this topic, together with World Enabled, we have gathered an international team of accessibility experts in a workshop to understand which accessibility-related information could be extracted from street panorama images (collected every year by the City of Amsterdam and saved after removing privacy sensitive information such as license plates and people). The experts were divided into three groups and we asked them to:
- Annotate the selected images with a red sticky note for bad accessibility practices and a green sticky note for good practices, writing down their explanation.
- Identify what type of accessibility-related information is missing on the city panorama images.

Remote workshop exercises on Miro. Source: Amsterdam Intelligence
We concluded that panorama images could allow us to identify the existence or lack of pedestrian features, such as obstacles, curb ramps, crossings. push buttons, tactile markings, street furniture, between others. However, precise measurements, time predictions, non-visual information, buildings accessibility and the contrast of pavements and signs cannot be evaluated from street view panorama images alone, due to visual properties or the dynamic lighting of the images.

Workshop results that answer ‘what could we identify with panorama images?’ Source: Amsterdam Intelligence

Workshop results that answer ‘what can’t we identify with panorama images?’ Source: Amsterdam Intelligence
This workshop allowed us to understand the broad spectrum of measuring accessibility for pedestrian mobility, for which many data sources are required. To prioritize and define our research directions we followed the following methodology:
- Collected the accessibility guidelines for designing a barrier-free public space, from the municipality of Amsterdam and United Nations Enabled;
- Combined the results of the workshop and the accessibility guidelines, categorized and described each accessibility-related feature;
- Created a survey for accessibility experts to measure the level of impact for each feature. By high impact, we meant the features that answer the need of most disability types and/or the pain points more often reported;
- Created a survey for data scientists to measure feasibility, regarding the available datasets;
- Prioritized based on the surveys’ results. We selected the city features evaluated with the highest impact and feasibility.

Topic priority matrix (impact/feasibility). Source: Amsterdam Intelligence
Research directions
Sidewalk and crosswalk accessibility assessment
People with disabilities frequently have trouble with obstacles on the sidewalk; crosswalks that are too long; missing curb ramps; missing tactile markings; press buttons positioned too high. These don’t allow them to proceed with their daily activities the same way people without disabilities do. So how could we map the presence or absence of such features?
It can be a challenging task to map accessibility obstacles. Fortunately, systems like project sidewalk allow us to virtually explore the streets of a city and label this type of information. Similar approaches could be done using aerial images or lidar data. Aerial data can, for example, be used to locate crosswalks and Lidar data to measure the height of sidewalks accurately.
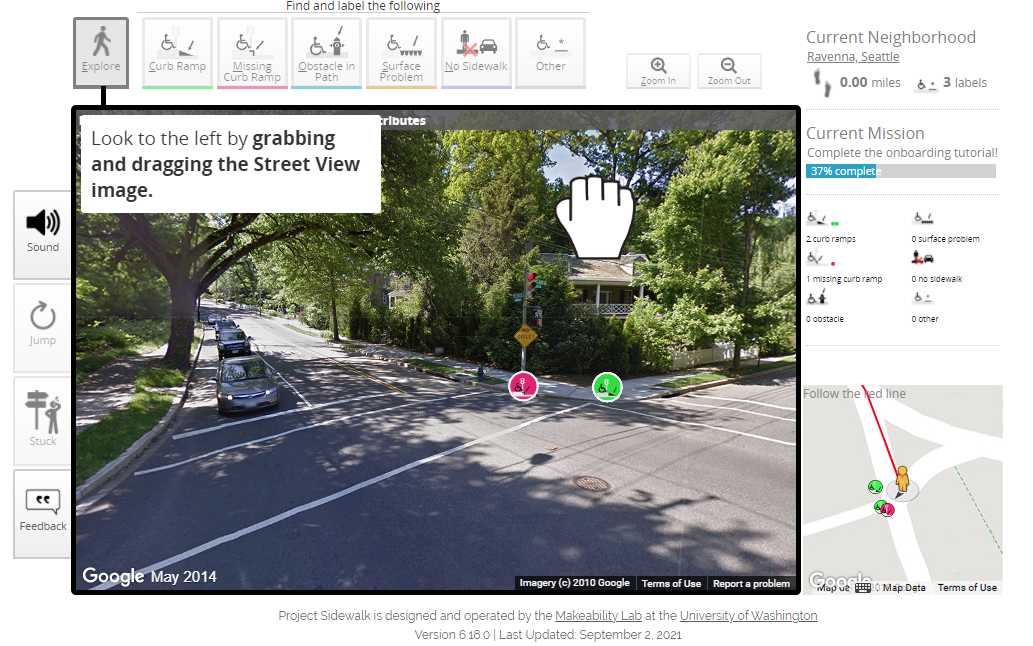
Project sidewalk’s labelling interface. Source: Amsterdam Intelligence
In the end, the collected data can be used to automatically detect these features in the whole city using computer vision techniques. Thus, this could result in a method for regularly measuring accessibility in a cost-effective way and on a large scale.
The applications of this data could feature both city officials and citizens. On one hand, we could give city officials updates on the city’s changing accessibility levels and identify which areas still need attention. On the other hand, we could add an extra layer of information to existing route planning systems, so they could offer more personalised routes to citizens.
Bicycle count prediction
Bicycles are another relevant accessibility bottleneck mentioned in our surveys, very characteristic of Amsterdam. Even though bicycles are considered temporary obstacles, they are still obstacles that can delay, block or be a hazard, especially for people with disabilities.
The dynamic nature of bicycles makes them harder to detect. However, by using historical counts of the number of obstacles on sidewalks (e.g. bicycles), it could be possible to use the characteristics of the street or neighbourhood to predict how likely it is that there will be obstacles on the sidewalk. The proximity of a bar would explain the presence of bikes during the evening, and a school would have more bikes parked during working hours.
The benefits of predicting the positioning of such obstacles can be twofold. On one hand, we can help city officials to identify busy areas of the city. With that information they can make informed decisions, as for example, add more bicycle parking in certain areas. On the other hand, we could add an extra layer of information to existing route planning systems, so they could offer more personalised routes to citizens, where they can avoid temporary obstacles or at least be aware of them.
Venue accessibility assessment
Unfortunately, people with disabilities (especially wheelchair users) frequently do not know if they can use a public building beforehand. Accessibility information about public venues is often entered manually, so there is missing information for plenty of areas in the city. As a result, citizens can end up going to a venue only to figure out that their entrance is impossible.
Some platforms offer information about the accessibility of certain venues. For example, on wheelmap you can find information about wheelchair ramps and accessible toilets. Even though it is a great initiative, it is limited by users entering this information. Another example is street view images, where it is possible to look at a certain venue and check if the door is wide enough. However, this still needs to be done manually, by the user. All these tasks could be replaced by computer vision techniques.
We believe that recognizing certain accessibility guidelines can be done through existing images, and we could give these ratings to places automatically. This would allow visitors to quickly verify what facilities are offered for a large quantity of venues. At the same time it would allow the city to monitor which venues are accessible, check if it is improving over the years, and allow the creation of policy based on the collected information.
Conclusion
In the next few years we will be working on these challenges, and while we do this we will continue to describe how it is going and what new insights have been generated. We do think that these are all promising new applications of AI, and hope that measuring accessibility with these types of techniques will eventually make the city accessible for all.
"The Amsterdam for All initiative developed in partnership with World Enabled will effectively leverage the powers of emerging technologies to address data gaps and unlock new and compelling solutions to a variety of access and inclusion barriers in the city. " - Ger Baron, CTO City of Amsterdam
Auteurs: Maarten Sukel & Cláudia Pinhão
Dit artikel is afkomstig van de website van Amsterdam Intelligence