Automatically labelling buildings in point clouds using BGT and AHN
Part of
Keywords
In a previous post we discussed how we can automatically filter the ground in point clouds using elevation data. Once this has been done, it becomes easier to separate the remaining points into clusters that represent various free-standing objects. However, we still need to label these clusters correctly!
In this blog post we discuss how we can automatically label buildings using a combination of BGT (a database of large topographical objects) and AHN elevation data. The reason to use both data sources simultaneously is that they complement each other: the BGT provides accurate and up-to-date 2D information, while the AHN adds a 3D aspect allowing us to take the building height into account as well.
Building footprints in BGT
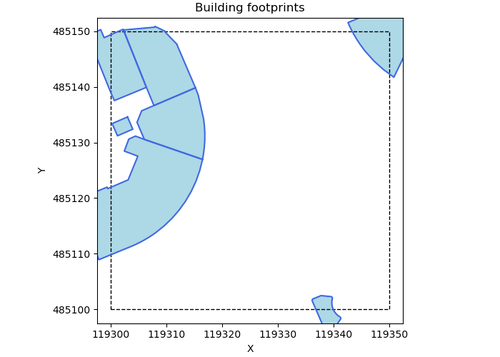
The BGT, or basisregistratie grootschalige topografie in Dutch, is a database of large topographical objects such as roads, buildings, power lines, train lines, etc. Buildings are stored as polygons representing the building’s footprint. For each tile of our point cloud, we extract the corresponding polygons (see image below).

Building footprints taken from BGT. The dashed square shows the area of the point cloud tile.
Then, we mark points that are inside this polygon (in terms of their <x,y> coordinates) as potential building points. Since both the BGT and the point cloud have a certain margin of error, we inflate the building footprint by 25cm to increase the number of points that are included. Later in this post we also discuss how we make sure that further protruding elements such as balconies are correctly labelled as well.
Building height using AHN
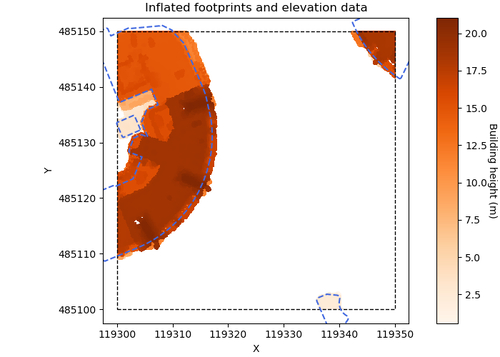
It can happen that there are points within the footprint that in fact do not belong to the building. A typical example are trees that partially overlap with the footprint where their branches overhang the building’s roof. To prevent such mistakes, we use AHN3 elevation data, which includes building elevation data, i.e. height of the roof. Similar to the ground filter we discussed previously, we extract the building height data corresponding to the point cloud tile, and use this as a cut-off (again with a 25cm margin of error) in the <z> coordinates. As such, we end up marking all points that fall within the footprint in terms of <x,y>, and are below the building’s roof in terms of <z>. The image below shows how these two data sources combine.

Inflated building polygons (dashed blue lines) overlayed on AHN elevation data showing the building height (in orange/red).
Completing the facade using region growing
As mentioned before, certain protruding elements such as balconies, canopies, and bay windows (the typical Dutch erkers) are not contained in the footprint polygon. In order to include these, we use a region growing technique. One option is point-based region growing, in which for each point features are computed in order to determine whether that point should be included or not. This method is very precise, but also computationally expensive.
Since we have a very large number of point cloud tiles to process, we opt for the more efficient approach of cluster-based region growing. This method does not make a decision for each individual point, but instead it first finds connected components in the point cloud. We then mark an entire component as building if the fraction of that component that was already marked previously exceeds a threshold. To improve the accuracy of this approach, we use different settings for this threshold, as well as for the level of detail in the connected component search, for different parts of the building facade: a more cautious approach near the ground level where there is more clutter; and a coarser approach near the roof, where the point density is lower.
Result
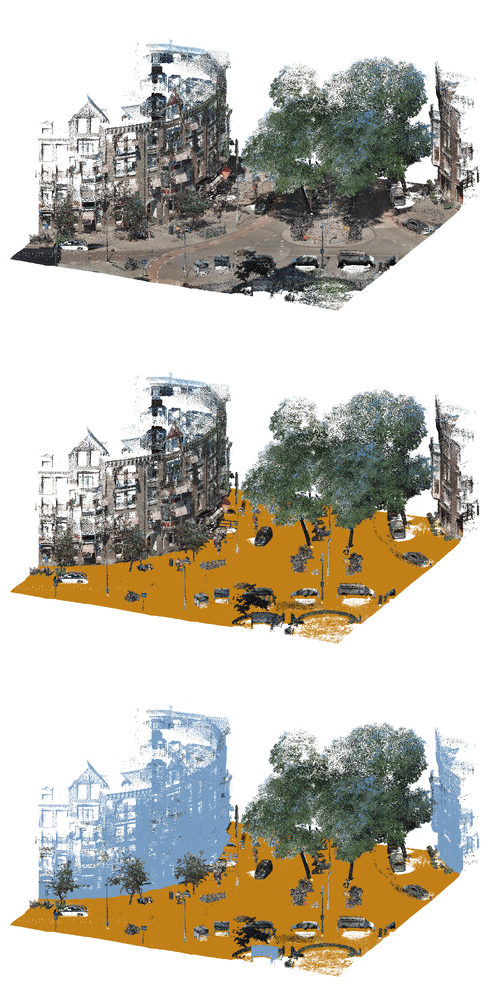
Finally, we label all points marked in the previous steps as ‘building’ in the point cloud. An example of the resulting labelling is shown in the animation below.

This animation shows the result of our automatic labelling of ground (brown) and buildings (blue).
Code
For more details and example code, see our project on GitHub. There we also provide Jupyter notebooks which explain the labelling of ground and buildings as well as the two region growing methods.
Auteur: Daan Bloembergen
Dit artikel is afkomstig van: Automatically labelling buildings in point clouds using BGT and AHN (amsterdamintelligence.com)
Image credits
Icon image: Automatically labeling buildings