Urban street-level point clouds provide a rich source of data that can potentially be used to accurately map the public space. Applications include localising street furniture and extracting relevant properties, monitoring tree health, enriching 3D models, and mapping accessibility by measuring sidewalk clearances and localising ramps, just to name a few.
These applications share a common requirement: we need to know which pixel belongs to which type of object, a problem that is commonly known as semantic segmentation. Recent years have seen an increasing interest in this topic in the scientific community, leading to a range of semantic segmentation algorithms, typically based on deep learning.¹ A prerequisite for using such deep learning algorithms is the availability of large datasets to train on.
A major challenge when dealing with point clouds, however, is precisely the lack of publicly available general purpose annotated datasets. Even when such datasets are available, variations in building style, types of vegetation, and other location-specific details make it hard to translate results from one dataset to another. Therefore, many of these applications still require the creation of a custom annotated dataset as a first step. Manually annotating point clouds can be quite cumbersome and time-consuming, however, which creates a substantial hurdle to take before even starting to work on actual algorithmic solutions.
In this blog post we built on previous work in which we extracted ground and buildings from such point clouds using smart data fusion with public data sources such as elevation data and topographical maps. We summarize previous results, and explain how we additionally label cars, pole-like objects, and trees. Finally, we give a sneak-peek into some first results of training a deep semantic segmentation model on our annotated dataset.
Note: we presented this project at the 10th International Workshop on Urban Computing, and a paper² describing our approach in detail is available on arXiv.
Datasets
Our point cloud, provided by CycloMedia, encompasses the municipal area of Amsterdam and Weesp. For now, we focus our attention on Weesp alone. The point cloud includes <x, y, z> coordinates as well as RGB and intensity values, and is cut into 50x50 meter tiles. The Weesp area comprises roughly 3,500 tiles with a total of 7 billion points.
For our data fusion approach we use the Dutch AHN3 elevation data, BGT topographical maps, and NDW data for traffic sign locations. The image below shows examples of these data sets corresponding to the point cloud tile in the header image of this blog post.

Elevation data and topographical map corresponding to the point cloud tile in the header image.
Our approach: smart data fusion
We use these two data sources to automatically label objects of six classes: ground, buildings, cars, trees, street lights, and traffic signs. The latter three classes are processed similarly, since each is pole-like in nature and represented as a point on the topographical map. Here we only give a brief overview of the main idea, for more detail please refer to our paper or the accompanying Jupyter notebooks on GitHub.
Ground
We use the elevation data to automatically label all points within a small margin from the elevation surface as ground. The advantage of this approach is that it works for flat as well as curved surfaces.
Buildings
We use footprint shapes from the BGT topographical map to label all points within the footprint as building. Elevation data is used to limit the height. Region growing based on connected components is used to include balconies, canopies, and other protruding elements that are not included in the footprint.
Cars
Car-shaped clusters above road parts and parking bays in the BGT topographical map are labelled as car. For each cluster we compute a minimum three-dimensional bounding box, and match its dimensions to the range of expected values for typical cars.
Trees, lamp posts, traffic signs
We look for pole-shaped clusters in the point cloud close to their expected locations as given in the BGT and NDW data sources. To reduce the number of false positives we only consider matches that have a certain minimum height, and whose diameter falls within an expected range for the type of object in question.
Final step: check and correct
We manually check the resulting labels, correct small errors, and add missing objects.
An example point cloud tile labelled by our method is shown in the figure below. Note that this is before any manual correction. As you can see, many objects are labelled accurately, with no false positives. However, one tree and one street light have been missed. In the case of the tree, this is due to the fact that the stem is leaning sideways, which prevented our method from finding a vertical pole-like structure. The street light on the other hand was too far away from its expected location, and hence was ignored.

Example point cloud labelled by our method. Gray pixels have not been assigned a label.
Creating a labelled dataset for semantic segmentation
To give an indication of the reduction in human time and effort that results from our automated labelling, we (read: Chris) manually labelled a few tiles and compared this experience to simply correcting the labels in a pre-labelled tile. Manually labelling a tile takes at least one hour, while correcting small mistakes by our approach takes roughly five minutes on average, which is a 20-fold reduction.
This makes it possible to create a labelled dataset that is big enough to train a deep semantic segmentation algorithm in a matter of hours, rather than weeks. To demonstrate the potential, we (again: Chris) used our method to label 109 out of the 3,500 tiles of the Weesp dataset. Interesting to note here is that since we simply want enough labelled training examples, it does not matter if our approach misses a few objects, as long as the ones that are labelled are correct. We then trained RandLA-Net³, a state-of-the-art semantic segmentation model for point clouds, on this labelled subset using a 99/10 train/val split. Performance on the validation set is given in the table below:

Mean IoU (Intersection over Union) and per class IoU on the validation set (higher is better).
Clearly the model performs very well for ground, buildings, trees, and cars. Performance is slightly lower for street lights, and even less for traffic signs. The latter is partly due to the imbalance in the dataset: street lights and traffic signs only make up 0.17% and 0.07% of the training set, in terms of number of points, respectively.
As a final example, the figure below shows a point cloud tile that was not part of the labelled dataset, and which was subsequently labelled using the trained RandLA-Net model. This further demonstrates the quality of RandLA-Net’s predictions. The majority of mistakes are objects of classes that were not included in the training data, such as small poles (bollards), fences, low vegetation, etc.
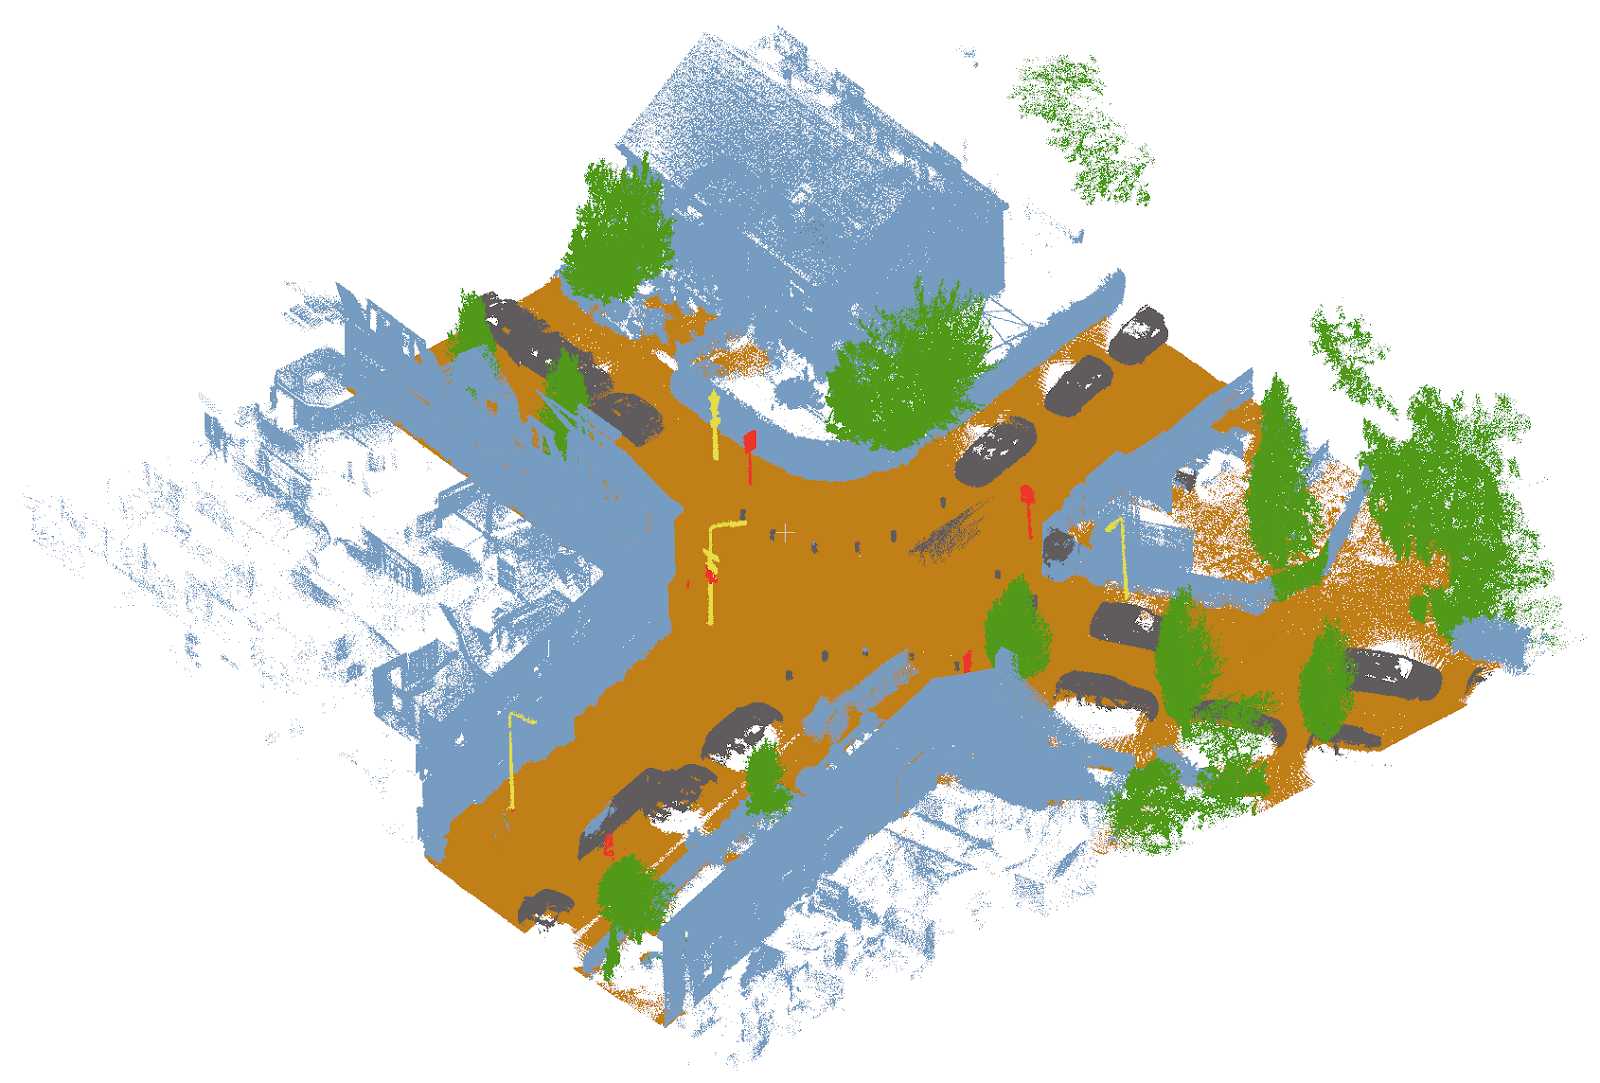
Example point cloud, not included in the training set, labelled by the trained RandLA-Net model.
What’s next?
These first results show the great potential of using smart data fusion to train high quality semantic segmentation models. Our approach is particularly suited for large-scale point clouds with hundreds of millions of points, where manual annotation is infeasible. This offers great potential for cities to automate (parts of) the process of cataloguing street furniture, perform change detection, map out accessibility, and much much more.
We are currently using our method to locate all street lights in Weesp. If you want to know how that goes, stay tuned!

Resources
- Our code is available on GitHub; two point cloud tiles are provided to try out our methods.
- For more technical details, see our paper on arXiv.
- If you liked this blog post so much that you would like to have it explained to you again in convenient video format, check out our presentation at the Urban Computing workshop on YouTube.
References
[1] Jiaying Zhang, Xiaoli Zhao, Zheng Chen, and Zhejun Lu, 2019. A review of deep learning-based semantic segmentation for point cloud. IEEE Access 7 (2019), 179118–179133.
[2] Daan Bloembergen and Chris Eijgenstein, 2021. Automatic labelling of urban point clouds using data fusion. arXiv preprint arXiv:2108.13757.
[3] Qingyong Hu et al. 2020. RandLA-Net: Efficient semantic segmentation of large-scale point clouds. In Proceedings of the IEEE/CVF Conference on Computer Vision and Pattern Recognition. 11108–11117.
Auteurs: Daan Bloembergen & Chris Eijgenstein
Dit artikel is afkomstig van: Automatically labelling urban point clouds using smart data fusion (amsterdamintelligence.com)