As Amsterdam is the most populous city of the Netherlands by housing nearly one million citizens, we increasingly use AI technologies to improve the speed and quality of the complex tasks that affect this large population. However, to ensure that these improvements are felt by each citizen and population group equally, we pay a lot of attention to investigate the fairness of algorithms. In this blogpost, we dive into Hierarchical Bias-Aware Clustering, which is a new method to detect biases which cause the algorithm to treat groups of persons differently. This method can be added to the City’s growing toolkit of instruments that are used to assess the fairness and inclusiveness of algorithms and to eventually ensure that all the algorithms used by the City are ethical.
The Fairness of Algorithms
Algorithmic fairness relates to the absence of any prejudice or favouritism toward an individual or a group based on their inherent or acquired characteristics, such as ethnicity, age and gender [1]. When an algorithm produces skewed outcomes based on these sensitive attributes, it is said to contain undesired bias. As Figure 1 shows, this bias can be found at multiple stages of the algorithm development cycle.
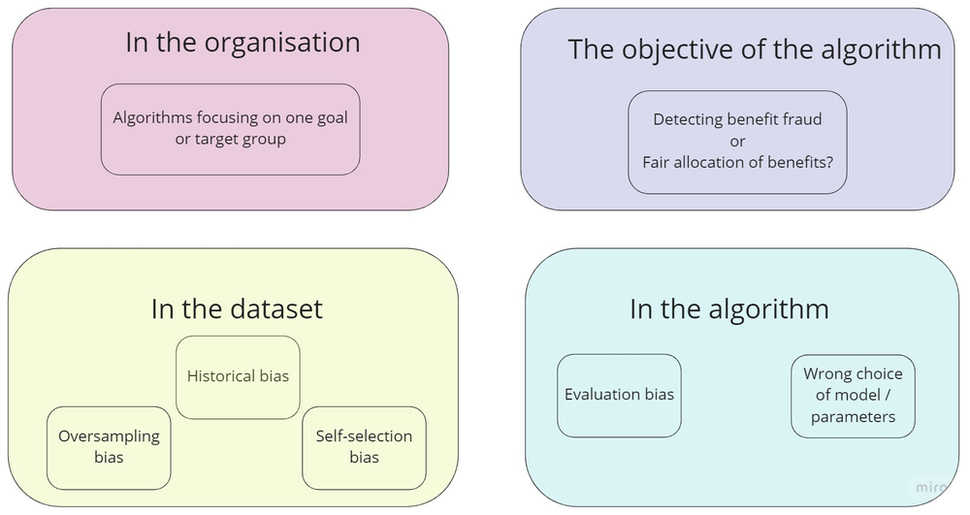
Potential sources of undesired bias
In the past few years, several projects were set up to research the fairness of Amsterdam’s algorithms by finding, mitigating and preventing undesired bias. For instance, Rik Helwegen looked into using causality for training fair models and enforcing counterfactual fairness [2], Tim Smit researched the construction of the needed causal graphs. and Joosje Goedhart investigated the cost of group fairness when compared to individual fairness.
However, the studied methods required much domain expertise from civil servants and developers: for many fairness instruments, the sensitive attributes in the dataset often needed to be pre-specified. Besides the pre-specification of sensitive attributes, some fairness instruments require civil servants to predefine the vulnerable groups in the dataset on which an algorithm has more potential to produce skewed outcomes. Moreover, since the City uses a wide range of different algorithms, a fairness method should be able to cater to these diverse models. Therefore, to reduce the need for domain expertise and to cater a more generalizable fairness instrument, we propose the method Hierarchical Bias-Aware Clustering (HBAC) which is inspired by a study conducted by Misztal-Radecka and Indurkhya [3], who developed a bias-aware hierarchical clustering model to automatically detect discriminated groups of users from recommendation algorithms.
Error Patterns
The main rationale behind the Hierarchical Bias Clustering method is to use the errors produced by the algorithms as a light in the dark to find bias. As no algorithm is entirely error-proof, error patterns give insight into how an algorithm can be skewed towards certain groups. These errors can be categorised into False Positives and False Negatives for classification algorithms, which are shown on the confusion matrix below. With these errors, we automatically detect groups for which an algorithm is producing substantially more errors, hereby indicating discrimination bias, or few errors, which highlights a group favoured by the algorithm. The formation of groups based on these error discrepancies is handled by a clustering algorithm.

The confusion matrix reports the number and type of errors that the algorithm has produced
Clustering Methods
The clustering algorithm is applied on the results obtained from the algorithm of which we want to investigate its fairness. The main task of the clustering model is to find a natural grouping among data points that, ideally, lead to meaningful or useful groups. In our case, we want to find clusters of persons sharing similar characteristics, such a similar age or the same gender, and of which the cluster has a high discrimination bias, hereby potentially indicating an unbalanced dataset or a bias in the algorithm’s objective. A high discrimination bias implies that the algorithm produced substantially more errors for this group of persons when compared to all the other groups. We could also use the bias to even find a favouring bias, that is, a group of persons for which the algorithm produces considerably less errors. To find these high discrimination or favouring biases, we added the errors as a new attribute in the dataset. However, since we wanted to prevent the situation of overusing the errors and ending up with clusters containing persons who shared no similarities except for the presence or absence of errors, we experimented with scaling methods for the error feature. This error-scaling trade-off is illustrated in the Figure below.
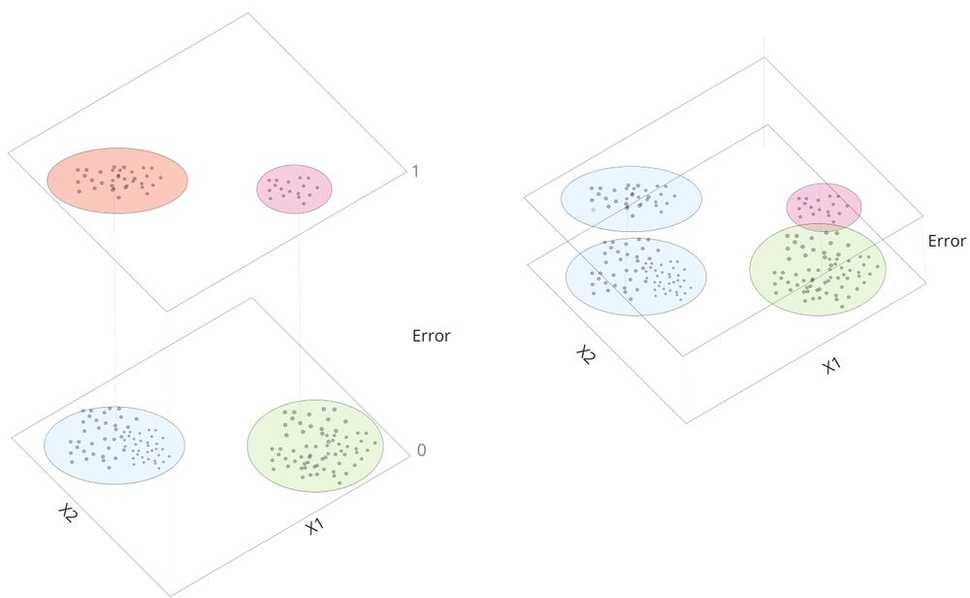
The scaling of the errors affects the clustering space. Including the errors as a clustering attribute should be balanced to prevent forming clusters with either all or none of the errors as the property that defines a cluster. The clustering space on the left shows that the clusters are primarily isolated based on the error attribute, which is undesirable as we end up with uninformative large clusters with persons sharing only few similarities. Contrarily, the clustering space on the right shows a situation where within a single cluster of persons sharing similar characteristics, we only isolated a group of persons for which the classifier produced more errors. Thus, the situation on the right is more desirable.
The HBAC Pipeline
Now that we studied the key components of HBAC, it is time to delve into the methodology for this fairness instrument. Essentially, the methodology comprises three consecutive steps:
- Preprocessing - we obtain the results of the classification algorithm on the test set, which contains the instances, features, ground truth labels and the classifier’s predictions. The categorical features are converted to one-hot encodings, as clustering algorithms require numerical or ordinal data to calculate distance between the features.
- Feature scaling - the features of the instances are normalized to ensure that each feature has the same scale. The error feature is scaled with a higher scaling factor than the other features to increase primarily form of clusters based on discrimination bias.
- Bias-Aware Clustering - we apply the HBAC procedure on the dataset to find clusters with a high discrimination bias.
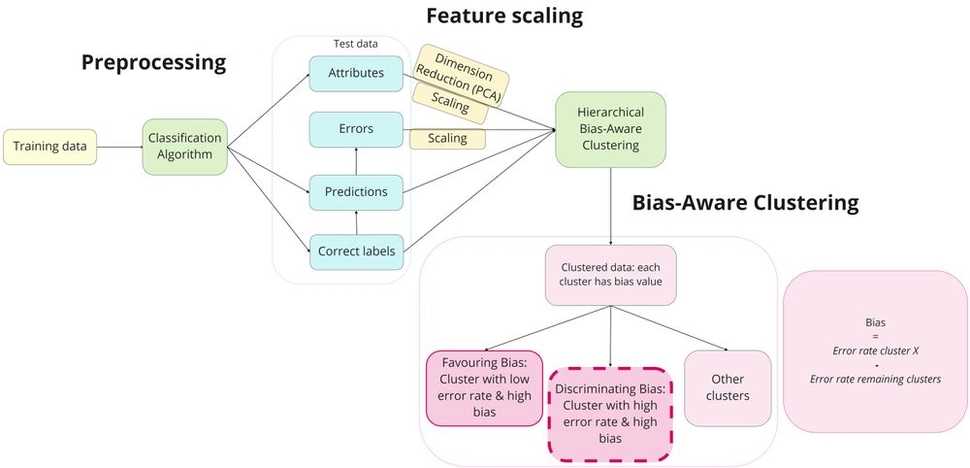
The HBAC pipeline
The Hierarchical Bias-Aware Clustering Procedure
After scaling and preprocessing the dataset, all instances are placed in the same cluster. Then, we split this cluster hierarchically into smaller clusters with any standard clustering algorithm. During this study, we experimented with K-Means, DBSCAN and MeanShift. Then, we calculate the performance (or: error rate) of the classifier on each cluster using a performance metric, such as Accuracy, Precision or Recall. This evaluation metric of the cluster is then used to calculate the bias, which is formalized as follows:

where MG indicates the performance of a group G and M\G represents the remaining clusters.
Based on this bias definition, we state that a cluster has a discrimination bias when the bias is smaller than zero, as the classifier produced substantially more errors for this cluster when compared to the other groups and therefore has a low(er) performance. Contrarily, a favouring bias occurs when the bias is higher than zero.
After calculating the discriminating bias for each of the clusters, we compare these biases with each other to determine which of these clusters will be split into new clusters during the next iteration. Besides the discrimination bias, we also use criteria such as a minimal splittable cluster size to select a cluster with a sufficiently large size, since we want to find meaningful groups of persons for whom the classifier is potentially discriminating against.
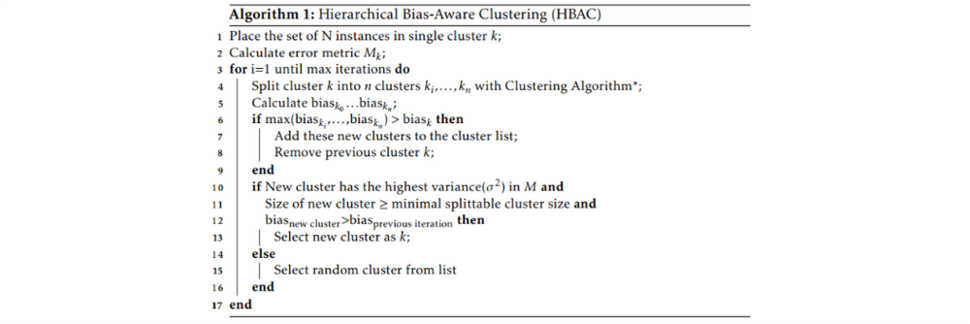
The pseudocode of the Hierarchical-Bias Aware Clustering algorithm
Figure 5 shows an example of how HBAC identified clusters with a high discrimination bias on a synthetic dataset, where we manually inserted clusters with higher error densities. As depicted on Figure 5, HBAC-DBSCAN managed to find these dense regions of errors. Besides our experiments on two synthetic datasets, we also applied HBAC on COMPAS and another real-world dataset. COMPAS is a dataset used by the US courtrooms to predict the likelihood of defendants to commit another crime. We discovered that DBSCAN succeeded in finding the highest discrimination bias on the synthetic dataset, whereas K-Means was most effective in identifying the highest biases on the real-world datasets.
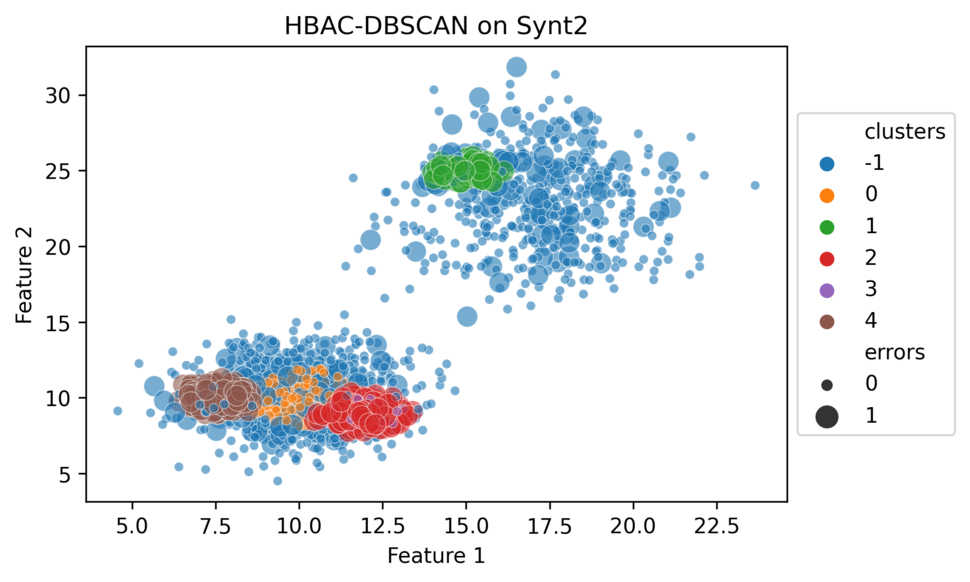
A visualisation of the clusters identified by HBAC-DBSCAN on a synthetic dataset containing three clusters with a higher error density within larger clusters with lower error densities. These “error clusters” represent persons sharing similar feature values but who were misclassified by the algorithm. Each colour represents a cluster and the bigger dots indicate instances with misclassifications.
Describing the discriminated groups
After identifying the clusters with the highest discrimination bias, we are interested in describing the persons within these clusters. Using those descriptions and analyses on the discriminated groups, we can understand which citizens might be potentially affected by the misclassifications, and we could then use this information to retrace why the algorithm underperformed on these persons. This helps with developing effective counteractive mechanisms that mitigate the algorithm’s discriminating or favouring behaviour. Multiple visualisations can be used to highlight and compare the persons in the discriminated cluster and in the remaining groups. In our current research, we used parallel coordinate (Fig 6) and density distribution plots (Fig 7), to describe the persons in the cluster with the highest discrimination bias. With a parallel coordinate plot, we compare the average values for each feature between the discriminated cluster and the remaining clusters. The parallel coordinate plot on Figure 6, for example, shows that the discriminated cluster contained more persons who had an African-American ethnicity when compared to the other clusters. On the other hand, density distribution plots, such as the one displayed on Figure 7, are used to compare the distributions of the discriminated and the remaining clusters for each feature separately. These visualisations are of key importance for civil servants who want to become aware of which groups an algorithm is potentially discriminating against.
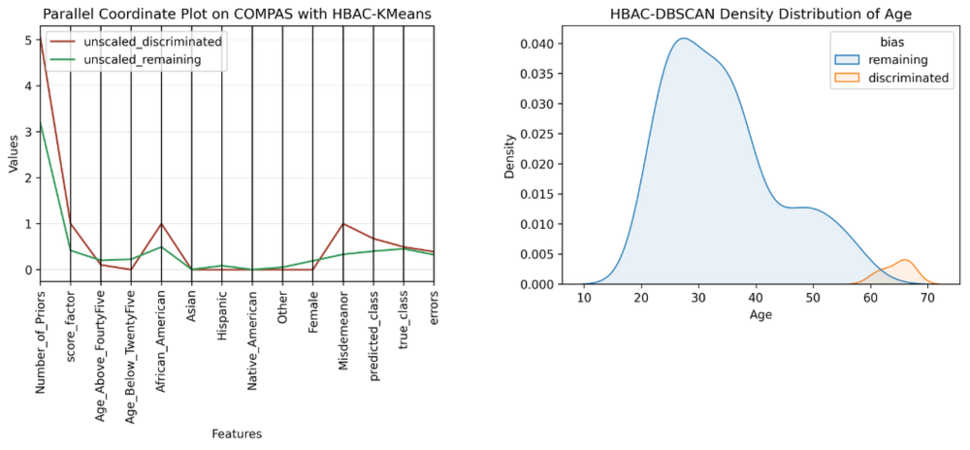
Parallel coordinate plot (left) and density distribution plot, which shows that the persons in the discriminated cluster are relatively older persons (right)
Current Findings
To further refine the Hierarchical Bias-Aware Clustering method, we experimented with different error scaling factors, clustering algorithms and visualisation techniques on two real-world and two synthetic datasets. Based on our observations, we found that K-Means was the most suitable clustering algorithm for HBAC, since it managed to find the highest discrimination bias in three of the four datasets. Moreover, HBAC-KMeans also scored highest in terms of scalability and understandability, which were the desired properties of a bias discovery method for the City. Nevertheless, our experiments with DBSCAN and MeanShift provided us with new insights about what kind of datasets are suitable for which kind of clustering technique, since these density-based clustering algorithms performed better on the synthetic datasets than K-Means did. This result could be attributed to the nature of the synthetic datasets: they contained clusters of “errors” within a larger cluster, which DBSCAN and MeanShift were able to pick up on due to their ability to form clusters based on shifts in data densities.
Future Prospects
Although HBAC showed promising results in terms of automatically detecting groups with a high discrimination bias, more work is required to increase the scalability and generalizability of this fairness discovery instrument. This can be done by adding more error metrics besides accuracy which can be used to calculate the bias. Additionally, to make HBAC applicable on the results of regression algorithms instead of only classification algorithms, we could use the residuals as an error metric, hereby allowing a wider range of algorithms to be examined for bias. Besides implementing more error metrics, more attention should be paid to develop intuitive visualisations that support civil servants in investigating the fairness of their algorithms. After all, it is precisely these visualisations that highlight the groups who are treated differently by an algorithm.
Conclusion
The findings on this bias discovery method, although preliminary, suggest that HBAC can support developers, civil servants and other stakeholders with further investigating the presence of the more complex biases in classification algorithms, of which it is difficult to pre-specify the sensitive attributes or vulnerable groups. Using HBAC, the City of Amsterdam can become more open and transparent towards citizens about the presence of undesired bias in AI technologies. For example, the visualisations could be used by the City to report publicly on how fairness is evaluated in Amsterdam’s Algorithm Register. Ultimately, we want to use HBAC to discover bias, after which we can use other fairness instruments to mitigate and prevent this bias from potentially harming a citizen.
For more information about fairness in general and the HBAC pipeline in specific, see the Github page and a recent presentation.
[1] Mehrabi, N., Morstatter, F., Saxena, N., Lerman, K., & Galstyan, A. (2019). A survey on bias and fairness in machine learning.
[2] Helwegen, Rik, Christos Louizos, and Patrick Forré. "Improving fair predictions using variational inference in causal models." arXiv preprint arXiv:2008.10880 (2020)
[3] Misztal-Radecka, J., & Indurkhya, B. (2021, may). Bias-Aware Hierarchical Clustering for detecting the discriminated groups of users in recommendation systems. Information Processing and Management, 58(3), 102519. doi: 10.1016/j.ipm.2021.102519
Auteur: Selma Muhammad
Dit artikel is afkomstig van: Auditing Algorithmic Fairness with Unsupervised Bias Discovery (amsterdamintelligence.com)